v3.10.0MinorReleased

New Account Matrix, Forecasts & Quotas, Record Preview in Compact view, Tooltips and Sidebars and more

Coevera 3.10.0 extends visualisation to Account Management with the new Accounts Matrix view, adds Quotas and performance comparisons to Forecast Reports, and makes record previews configurable across compact views, tooltips, and sidebars — alongside mobile and usability improvements.

AccountsReportsMobile
Share
Features
3
Improvements
8
Security
Coming soon

Overview

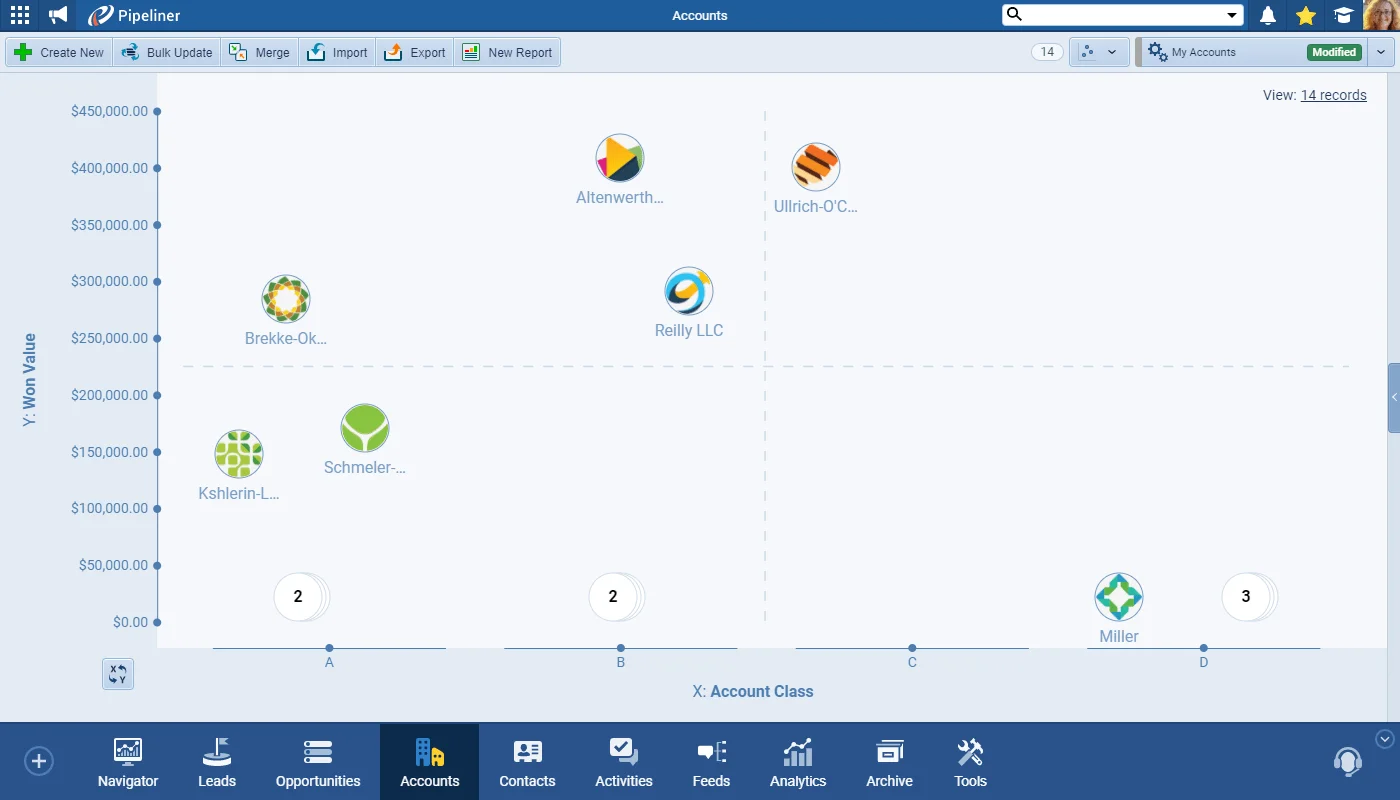
Two visualisation features lead this release. The new Accounts Matrix view lets users segment their Accounts on a bubble matrix using criteria they choose — selecting system or custom fields for the X and Y axes, displaying bubbles by Account Image, Class, or Owner, and focusing on specific ranges — so Customer Success, Sales, and Account Managers can each see where to focus next. Forecast Reports can now include a Quota, split evenly, based on historical performance, or entered manually, together with a Performance Comparison, while a new Forecast Graph shows how a team is tracking against its Expected Quota.

Record previews also become configurable: Admins choose up to 12 system or user-defined fields to show — and in most cases inline-edit — in the Preview Panel and Sidebar, the top 6 appear in QuickView tooltips, and each user can pin their own preferred fields to the top. On mobile, users can now attach multiple photos at once when creating or editing a record. A batch of smaller improvements rounds out the release, including a new Velocity field on Opportunities, skip-empty report scheduling, sum and average totals in Indicators, Google Forms updating existing records, filtering Reports by related records, and Feed speed gains of up to 40%.

What's in this release
  • The new Accounts Matrix view segments Accounts on a bubble matrix using criteria you choose.
  • Matrix axes can use system or custom fields — dropdowns, numbers, or dates — for the X and Y definitions.
  • Matrix bubbles can display by Account Image, Class, or Owner, with the option to swap the X and Y axes.
  • You can show or hide the segmentation grid and Account Names and focus on specific axis ranges.
  • Forecast Reports can now include a Quota, set Monthly, Quarterly, or Yearly, by Sales Unit or User.
  • Quotas can be split evenly, based on historical performance, or entered manually, and updated in one go (for example +10%).
  • A new Forecast Graph shows how a team is performing against its Expected Quota, with an optional Performance Comparison.
  • Admins can select up to 12 system or user-defined fields to show in the Preview Panel and Sidebar, most of them inline-editable.
  • QuickView tooltips show the top 6 selected fields, and each user can pin their own preferred fields to the top.
  • The Coevera Mobile App can attach multiple photos at once via Take Photo and Add Photo, with a Preview option.
  • A new Velocity field on Opportunities records the total days from creation to Win or Loss.
  • Report Scheduling can skip sending a scheduled report when it contains no data.
  • Indicators can show the total (sum) or average of the records included.
  • Google Forms can now update existing records, Reports can filter by related records, and Feeds are up to 40% faster.
Account Matrix

What we're proud of

Visualisation comes to Account Management

The new Accounts Matrix view lets each team segment their Accounts on a bubble matrix by the criteria that matter to them — total Won value against renewal timing, Account Class against Annual Won, or days since last contact — so they can see at a glance where to focus next.

01New · Accounts

Account Matrix

Account Matrix

We’re now extending the power of visualisation to Account Management in Coevera. The first step is the new Accounts Matrix View.

Users can select their own criteria to segment their Accounts into different views depending on their use case. Some scenarios might include:

Account Matrix Options

#account-matrix
02New · Reports

Forecasts & Quotas

Forecasts & Quotas

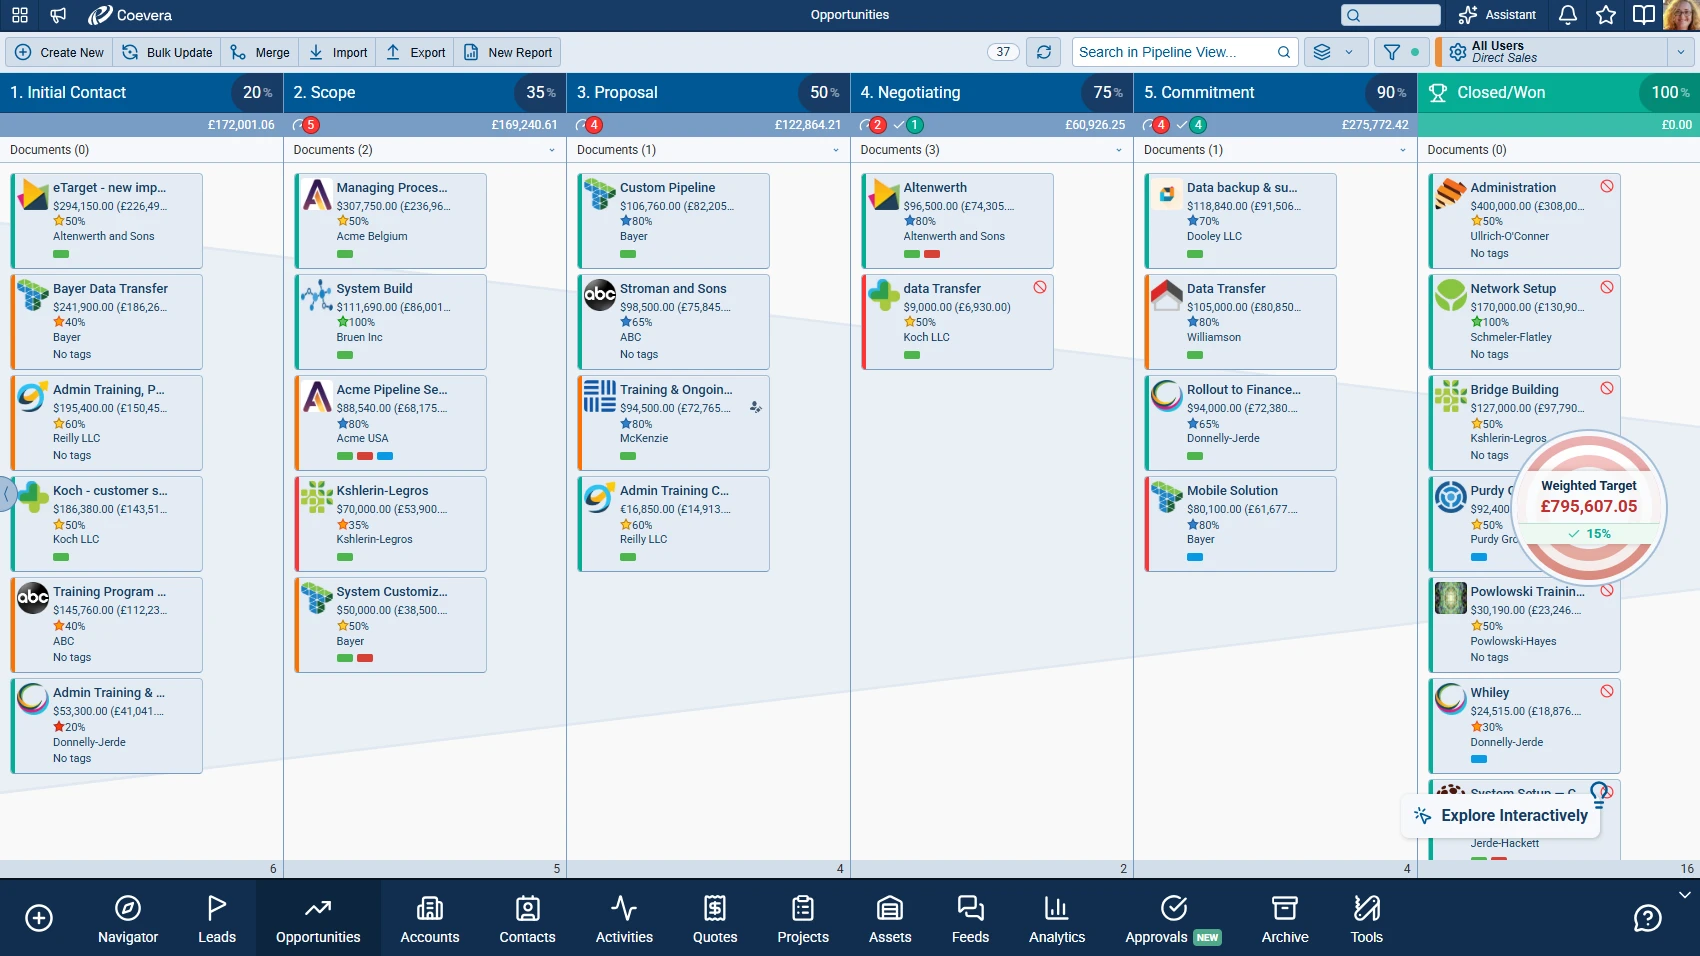
When creating a Forecast Report you can now choose to add a Quota and can split the total between your selected users or units evenly, based on prior performance or type it in manually. You can also add in a Performance Comparison based on the previous period or average performance, for example.

Your report can then show how your users are performing vs their Quota as well as against their Forecast.

You can select from a range of options including:

All screenshots

2
#forecasts-quotas
03New · Administration

Record Preview in Compact view, Tooltips and Sidebars

Record Preview in Compact view, Tooltips and Sidebars

Your Coevera Admin can choose a maximum of 12 fields to include in the new Interface Tab in Fields & Forms. These 12 fields can include both system and user-defined fields.

Users will then see — and in most cases be able to inline edit — those fields in the Preview Panel or Sidebar. In QuickViews (Tooltips), the top 6 selected fields will display. Individual users can also choose to “pin to the top” just their own preferred fields from those selected by the Admin and then close the full view and only see their selected fields.

All screenshots

4
#record-preview-in-compact-view-tooltips-and-sidebars

Various Improvements

Various ImprovementsReports

A bundle of smaller improvements: a new Velocity field on Opportunities, the option to skip scheduled reports with no data, sum and average totals in Indicators, Google Forms updating existing records, filtering Reports by related records, and Feeds up to 40% faster.

#various-improvements
Various ImprovementsMobile

Coevera Mobile Apps

We are also constantly improving our Mobile Apps you can check here.

#coevera-mobile-apps
Various ImprovementsMobile

Taking Multiple photos in Mobile Apps

In the Coevera Mobile App, users can attach photos by clicking “Take Photo” on Detail of record or in Global Action “Create New”. From there you can add multiple photos at once by clicking “Add Photo”. If you are not sure about a photo’s quality, you can also preview photos by clicking on “Preview”.

#taking-multiple-photos-in-mobile-apps

Frequently Asked Questions

It's a new way to visualise Account Management in Coevera, segmenting Accounts on a bubble matrix using criteria you select for the X and Y axes.

You can choose system or custom fields (dropdowns, numbers, dates) for each axis, display bubbles by Account Image, Class, or Owner, show or hide the segmentation grid and Account Names, focus on specific ranges, and swap the axes.

When creating a Forecast Report you can add a Quota — set Monthly, Quarterly, or Yearly, by Sales Unit or User — and split it evenly, by historical performance, or manually, with a new Forecast Graph showing performance against the Expected Quota.

Admins can choose up to 12 system or user-defined fields for the Preview Panel and Sidebar, most of them inline-editable, while QuickView tooltips show the top 6.

Yes. Individual users can pin their own preferred fields to the top from those the Admin selected, then close the full view to see only their chosen fields.

You can attach multiple photos at once when adding to a record or creating one, using Take Photo and Add Photo, and preview each photo's quality before saving.

See it in your own pipeline

Start a free trial and explore what's new in Coevera 3.10.0 for yourself.

No credit card required · Free 14-day trial

groupsTrusted by clients around the globeverified_userISO 27001 CertifiedshieldGDPR CompliantblockData never used to train AI