v3.9.0MinorReleased

Insights › Performance, New Customizable Dashboards and more

Coevera 3.9.0 leads with Insights › Performance for drilling into pipeline health by sales step or by user, replaces the old Dashboards with fully customizable Dashboards and report charts, and makes sending personalized email smarter and easier to manage.

ReportsEmail
Share
Features
3
Improvements
Security
Demnächst verfügbar

Overview

Two reporting upgrades lead this release. Insights › Performance gives deep, intuitive feedback on the health and performance of each of your pipelines: click into any pipeline to review performance by sales step or by user, comparing Open versus Lost Opportunities, Velocity, Conversion Rates, and Win Percentages by Step, switching between counts and values, and drilling into the actionable data behind every view. Alongside it, the Dashboards feature has been replaced by new customizable Dashboards — you can build custom reports, add a chart, and choose whether that chart also appears as part of a Dashboard.

Report charts can be added to a Dashboard with the Add to Dashboard option, or a new report started from a Dashboard — including one based on an existing Saved Profile — with layouts editable and charts resizable to create the right view. Available chart types span Pie, Line (single and multi), Column (single, stacked, multiple), and Bar (single and stacked) charts, as well as system types such as Scorecard. Rounding out the release, Sending Personalized Email becomes smarter and easier to manage: Coevera preselects the Primary Contact when you send from an Opportunity, greys out any template field that cannot be filled with personalized information, and shows exactly which records will be used before you send, letting you select any missing records so every field is completed.

What's in this release
  • Insights › Performance gives deep, intuitive feedback on the health and performance of each pipeline.
  • Drill into any pipeline to review performance by sales step or by user.
  • View pipeline health as Open versus Lost Opportunities by step or by user.
  • Compare Velocity by step or by user, plus Conversion Rates and Win Percentages by Step.
  • Switch Insights views between counts and values, and click to drill into the actionable data.
  • New customizable Dashboards replace the old Dashboards feature.
  • Build a custom report, add a chart, and choose whether that chart appears on a Dashboard.
  • Add report charts to a Dashboard with Add to Dashboard, or start a new report from a Dashboard.
  • Create a new report based on an existing Saved Profile.
  • Edit Dashboard layouts and resize charts to build just the right view.
  • Chart types include Pie, Line (single and multi), Column (single, stacked, multiple), and Bar (single and stacked), plus system types such as Scorecard.
  • Sending an email from an Opportunity automatically preselects the Primary Contact's details.
  • Template fields that cannot be personalized are highlighted in grey so they are easy to spot.
  • Before sending, see exactly which records will personalize the email and select any missing ones.
Insights Performance

What we're proud of

See what's really happening in every pipeline

Insights › Performance gives deep, intuitive feedback on the health of each pipeline — reviewing Open versus Lost Opportunities, Velocity, Conversion Rates, and Win Percentages by sales step or by user, in counts or values, with drill-down into the actionable data behind every view.

01New · Reports

Insights › Performance

Insights Performance

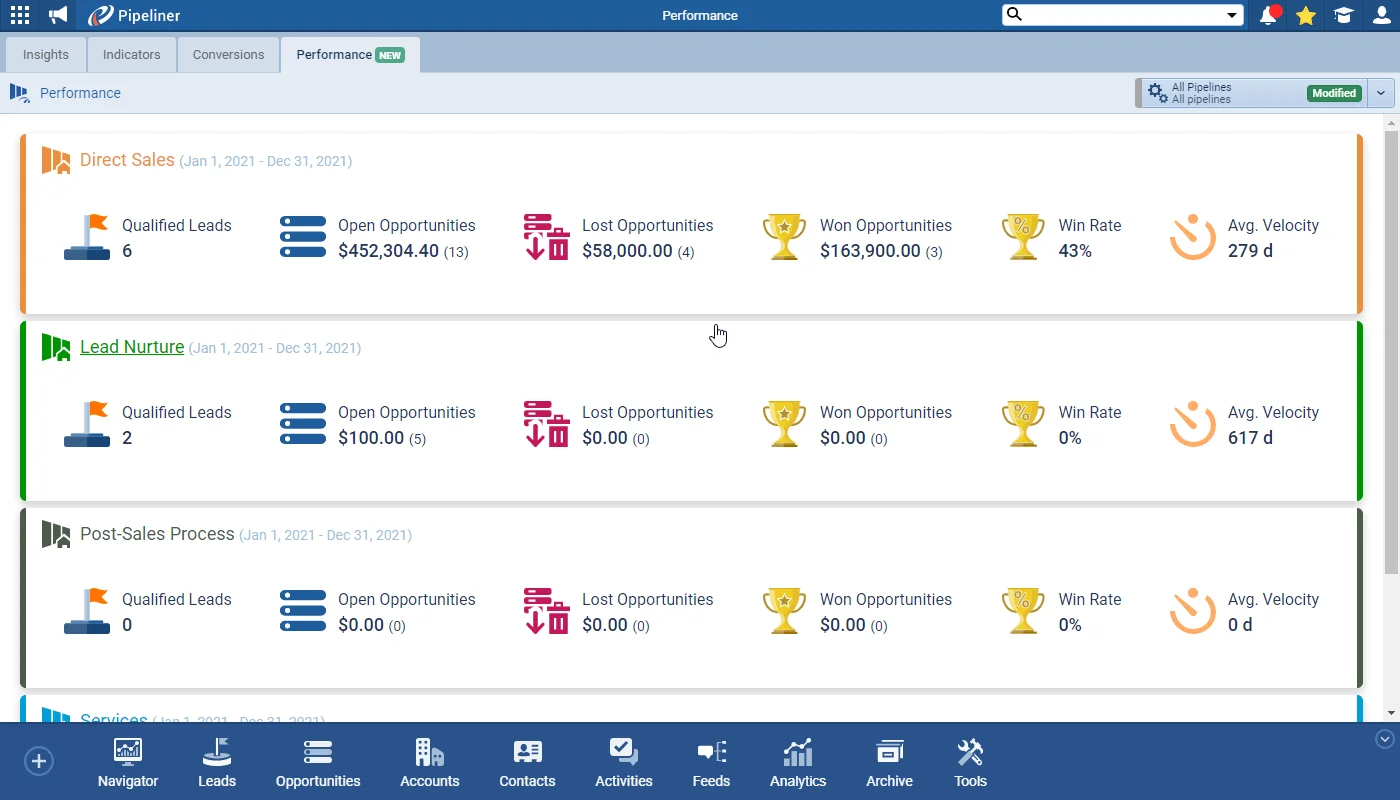
The Performance tab gives you deep and intuitive feedback on the health and performance of each of your Pipelines. Click on a pipeline to drill into deeper Insights, reviewing performance by sales step or by user. You can view the overall pipeline health showing Open vs Lost Opportunities by step or by user, Velocity by step or by user, Conversion Rates or Win Percentages by Step and can choose from counts or values.

You can also access the actionable data by clicking to drill down.

All screenshots

3
Documentation#insights-performance
02New · Reports

Customizable Dashboards

Customizable Dashboards

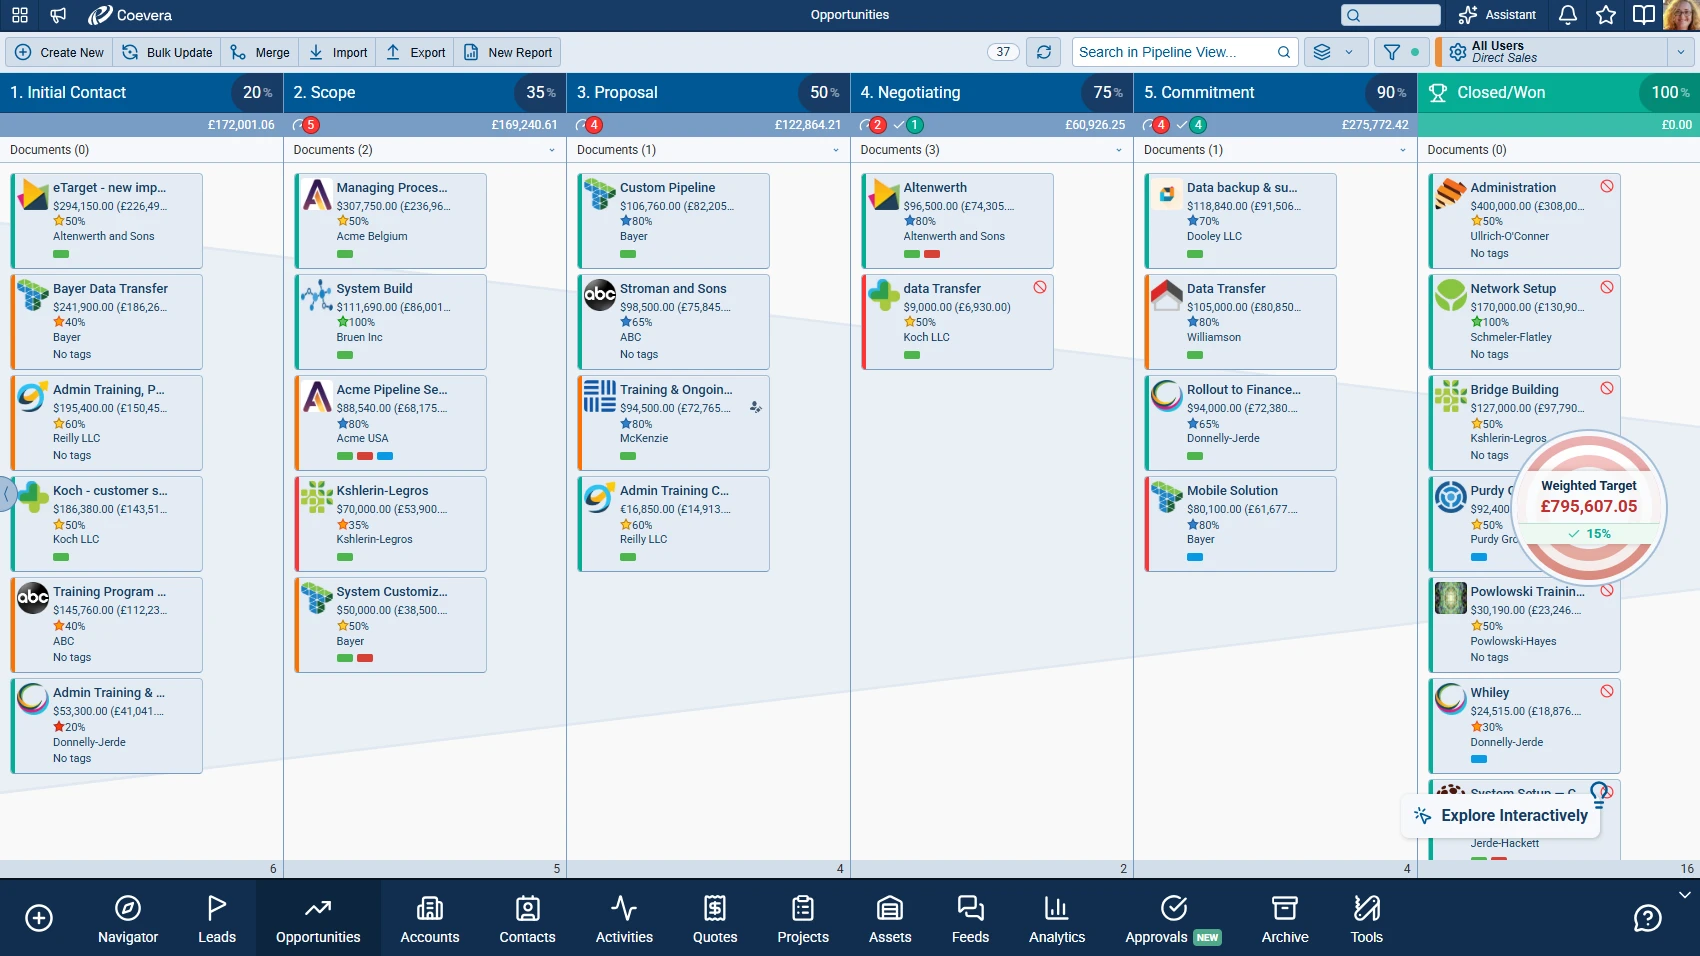
The Dashboards feature has been replaced by new customizable Dashboards. You can now set up your custom reports, add a chart to the report and then also choose whether you also want to be able to see the chart as part of the new custom Dashboards.

You can add Report Charts to a Dashboard using the “Add to Dashboard” option or create a new Report from a Dashboard. Note the new option to create a New Report based on an existing Saved Profile. Dashboard layouts can be edited and charts resized to create just the right view.

Available chart types include Pie Charts, Lines (single and multi), Columns (single, stacked, multiple), Bars (single and stacked) as well as system types such as Scorecard.

All screenshots

3
Documentation#customizable-dashboards
03New · Email

Sending Personalized Email

Sending Personalized Email

We’ve made email personalization smarter and easier to manage. When you send an email from an Opportunity, for example, we’ll automatically preselect the details for the Primary Contact. When using a template, any field that cannot be filled with personalized information will be highlighted in grey so you can easily identify them. When you click Send, you’ll be able to see exactly which records will be used for personalizing your email.

And you can select any missing records to ensure all fields are completed.

All screenshots

3
Documentation#sending-personalized-email

Frequently Asked Questions

It gives deep, intuitive feedback on the health and performance of each of your pipelines, including Open versus Lost Opportunities, Velocity, Conversion Rates, and Win Percentages by Step, viewable in counts or values.

Yes. Click into a pipeline to drill into deeper Insights and review performance by sales step or by user, then click to drill down into the actionable data behind each view.

The Dashboards feature has been replaced by new customizable Dashboards. You can build custom reports, add a chart to a report, and choose whether that chart also appears as part of a Dashboard.

Available chart types include Pie Charts, Lines (single and multi), Columns (single, stacked, multiple), and Bars (single and stacked), as well as system types such as Scorecard. Layouts can be edited and charts resized.

When you send an email from an Opportunity, Coevera automatically preselects the details for the Primary Contact. When using a template, any field that cannot be filled with personalized information is highlighted in grey so it is easy to identify.

Yes. When you click Send, you can see exactly which records will be used to personalize your email, and you can select any missing records to ensure all fields are completed.

See it in your own pipeline

Start a free trial and explore what's new in Coevera 3.9.0 for yourself.

Keine Kreditkarte erforderlich · 14 Tage kostenlos testen

groupsTrusted by clients around the globeverified_userISO 27001 CertifiedshieldGDPR CompliantblockData never used to train AI