Coevera’s new Revenue Intelligence Loop was introduced in our last article. Let’s now take a deeper look at this loop, and the powerful functionality it can provide for you.
Describing Revenue Intelligence
Let’s start off with what precisely revenue intelligence can bring to your organization.
With it, forecast accuracy and predictability can be greatly boosted. Eliminate the guesswork, and do away with the spreadsheets and “gut feeling” prediction.
Revenue intelligence is the only direct route to a closed sale. Revenue intelligence contains all that is required for your sales leadership to create accurate quotas and forecasts, and for your team’s pipeline management. It means predictable growth and instilling discipline regarding close dates, rating of deals and next sales process steps.
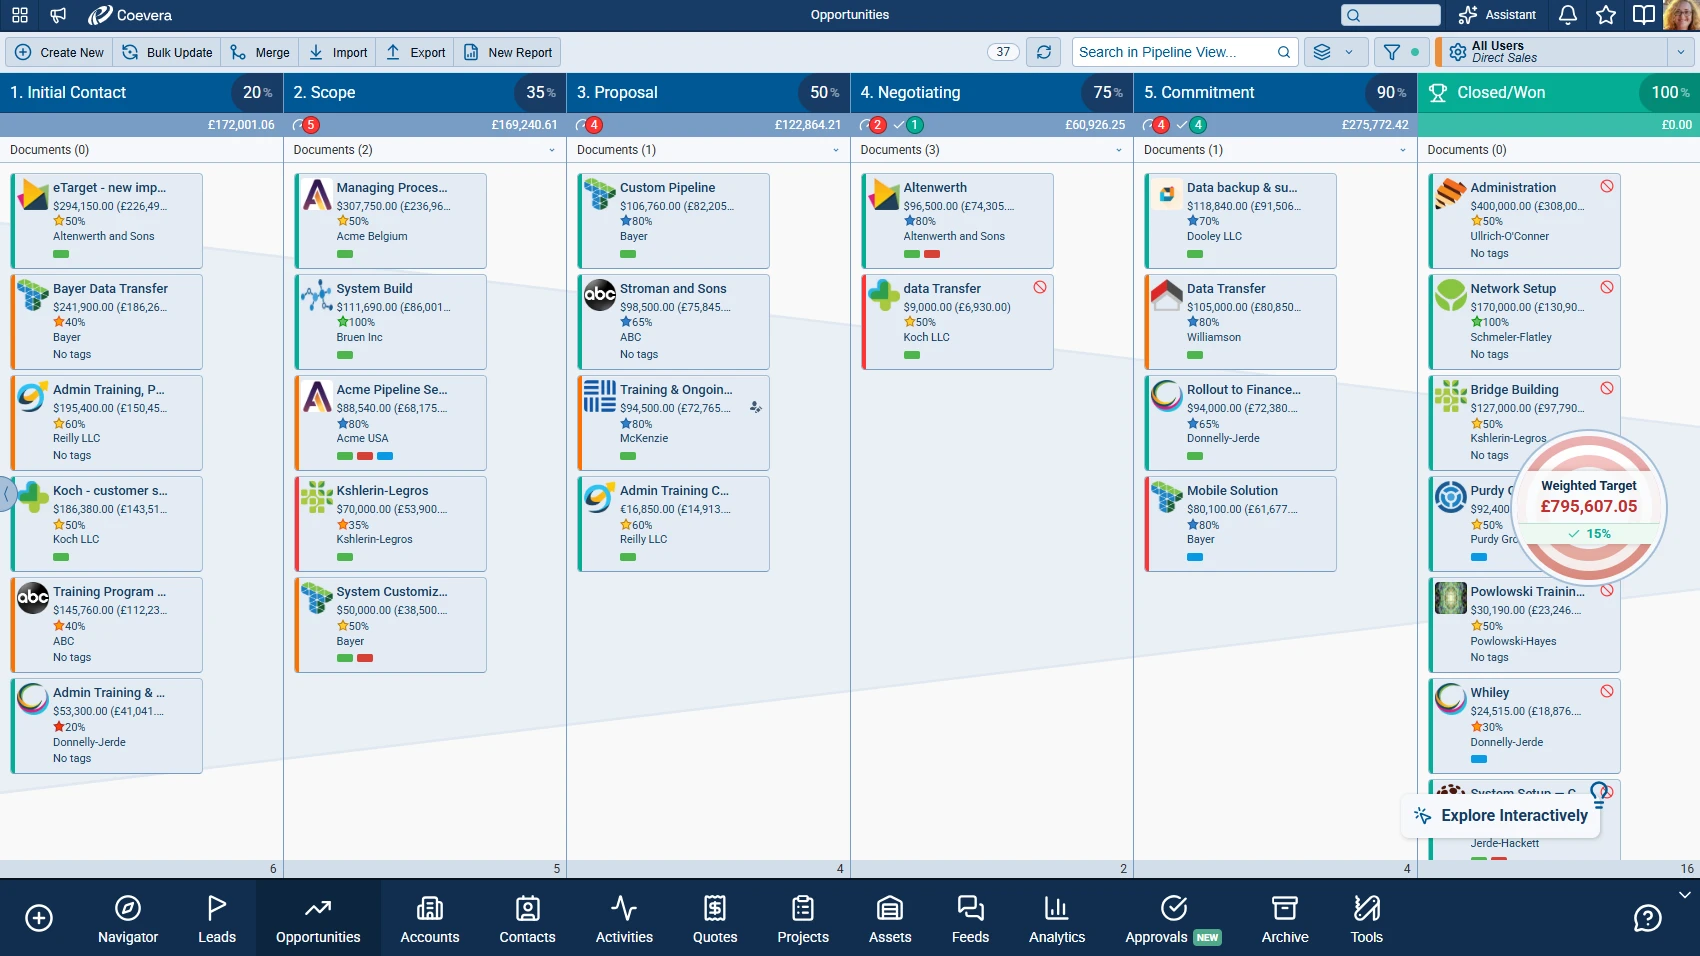
Risks and opportunities can be rapidly identified, and changes, risks and exceptions are instantly detected. Activities are connected to the pipeline, leads, and upsells. Leadership can easily manage rep efficiency and track goals throughout the sales process, and Coevera’s dynamic visualization allows you to uncover hidden coaching opportunities.
Actionable insights lead to increased win rates and shortened sales cycles. Drill down for a full understanding of what is occurring with sales. Filter reports at granular levels.
Static, historical-only reporting becomes a thing of the past with Coevera’s dashboard and advanced reporting.
It’s All Here
You almost never find the kind of robust CRM functionality that Coevera brings you right out of the box. You must either purchase very costly add-ons, or do without it.
As an additional note, many of Coevera’s features can be found nowhere else, and are totally unique to Coevera.
It Starts With Historical Data
Referring back to the loop graphic above, you’ll see that a perfect combination of historical data and real-time pipeline data is right at the center of revenue intelligence. This is the foundation that makes accurate quota and forecasting wisdom possible.
You won’t get accurate analysis without historical data. It is a problem that most companies face—either there is no historical data available, or it is inaccurate, so no real model can be created from it.
Something no other CRM offers is the Archive—a robust component of Coevera’s historical data. The Archive contains all deals, whether lost or won. Analysis can be conducted on reasons deals were lost or won.
As an example, you could conduct a yearly analysis and instantly see the amount of revenue won versus lost, your win rate, and the average time a deal spent in the pipeline over the year.
For a complete picture, you can utilize all of Coevera’s KPIs—sales velocity, average velocity, created, won and lost amounts and win rate—within the Archive.
Data Blended Together
It is crucial that real-time and accurate historical data are blended together so that attained goals can be compared with current progress.
Precision Targeting
Historical and real-time data both work within Coevera’s target functionality so that you can judge a target to be realistic or not.
Targeting is aided by breaking it down into quantity of opportunities, length of time for opportunities, opportunity sizes, number of leads needed to make the target, and more if needed. Targets are constantly updated as pipeline data is changed or added, so you always know how close you are to target achievement.
In our next article, we’ll take up our new Target feature in detail.
In practice: because Coevera ties every activity to the pipeline, leads and upsells, its dynamic visualization surfaces hidden coaching opportunities — letting leaders manage rep efficiency and spot risks, changes and exceptions the instant they appear rather than reading about them in a static, after-the-fact report.
Forecasts and Quota Creation
After target creation comes sales quotas—so let’s have a look at Coevera’s quota and forecasting.
With this functionality you can review revenue already gained, and to plan new revenue for products and product categories, units and users, for any time period. You can utilize different views to drill down into different views, allowing you to interact directly with the displayed information. Create quotas and enter committed forecast values so that they automatically show up in user pipeline views.
We make it easy, but also powerfully flexible, to create a forecast. You can forecast for users, sales units, products, product categories or accounts, and even organize your selections in a hierarchy. Different kinds of fields are available by the forecast type you select.
The forecast data range can consist of opportunity dates, closing data, or a custom date you create such as the start date of a project.
You can choose from a selection of values for your forecast. The default is opportunity value—but you could select from many others, such as value (currency), count (or sum) based on a numeric field such as opportunity count or product quantity.
Filtering is also available. For example, you might want to limit your forecast to opportunities linked to prospects rather than existing customers.
Organizing in Hierarchies
We mentioned earlier that you can create a forecast for products, product categories or accounts, users or sales units, and even organize forecast selections into a hierarchy.
Using a hierarchy allows you to plan your forecasts to roll up from one type of record to another – for example, individual users to a sales unit (team) or from certain accounts to a user or from users to products. You can use up to 5 levels in a hierarchy
Quota Values Added In
Quota values can be added into your forecast. The overall quota can be split between individual salespeople, units or other types of entities such as products. You can even split the quota by past sales performance. The quota can be updated when needed.
Drill Down to Raw Data3
There are numerous options you can use to drill down to raw data within a forecast. There are many ways to customize the way data displays and the way it is sorted.
When drilling down, you can also edit data, including making basic changes to the forecast data you first entered.
Share Forecasts
A forecast, once it has been created, can be shared. You can select and share the forecast with specific Coevera users on your team, or with all Coevera users.
Look No Further
With Coevera’s revenue intelligence, you get all the robust functionality you should expect from a full CRM application—without costly and complex add-ons. It’s all here, right out of the box.
Start Your Free, No-Obligation 14-Day Coevera Cloud Unlimited Trial!